

Trouble Shooting
This section address common problems you can find when using Unity, please choose the platform you are having problems at.
 Desktop
In MonoDevelop, the Debug button is greyed out!
- This means that MonoDevelop was unable to find the Unity executable; in the MonoDevelop preferences go to the Unity/Debugger section, and then browse to where your Unity executable is located.
Is there a way to get rid of the welcome page in Mono Develop?
- Yes, there is. In the MonoDevelop preferences, go to the Visual Style section, and uncheck "Load welcome page on startup".
Geforce 7300GT on OSX 10.6.4
- Deferred rendering is disabled because materials are not displayed correctly for Geforce 7300GT on OX 10.6.4; This happens because of buggy video drivers.
On Windows x64, Unity crashes when my script throws a NullReferenceException
- Please apply Windows Hotfix #976038.
Graphics
Slow framerate and/or visual artifacts.
- This may occur if your video card drivers are not up to date. Make sure you have the latest official drivers from your card vendor.
Shadows
I see no shadows at all!
- Shadows are a Unity Pro only feature, so without Unity Pro you won't get shadows. Simpler shadow methods, like using a Projector, are still possible of course.
- Shadows also require certain graphics hardware support. See Shadows page for details.
- Check if shadows are not completely disabled in Quality Settings.
- Shadows are currently not supported for Android and iOS mobile platforms.
Some of my objects do not cast or receive shadows
First, the Renderer has to have Receive Shadows on to have shadows on itself; and Cast Shadows on to cast shadows on other objects (both are on by default).
Next, only opaque objects cast and receive shadows; that means if you use built-in Transparent or Particle shaders then you'll get no shadows. In most cases it's possible to Transparent Cutout shaders (for objects like fences, vegetation etc.). If you use custom written Shaders, they have to be pixel-lit and use Geometry render queue. Objects using VertexLit shaders do not receive shadows either (but can cast shadows just fine).
Finally, only Pixel lights cast shadows. If you want to make sure that some light always casts shadows, no matter how many other lights are in the scene, set it to Force Pixel render mode (see Light documentation).
 iOS
iOS
Troubleshooting on iOS devices
There are some known scenarios where your game works perfectly in the Unity iOS Editor but doesn't work or doesn't even start on the actual device. The problems are often related to code or content quality. This chapter describes the most common scenarios.
Xcode 3.2.x fails to build application with error "libiPhone-lib.a, missing required architecture i386 in file Undefined symbols: "Register_UnityEngine_Input_GetMouseButtonDown()", referenced from: RegisterAllStrippedInternalCalls() in RegisterMonoModules.o
This build error usually happens when originally non-simulator SDK is selected in Player Settings, but later in Xcode SDK is switched to simulator. To run a simulator build you should choose simulator SDK in Player Settings.
Xcode 4.x fails to build application with error "No architectures to compile for (ARCHS=armv6, VALID_ARCHS=i386)."
Currently Unity has limited support for Xcode 4.x and some manual effort is required to build final application. Build&Run action will open Unity iOS generated Xcode project, but it won't select proper build target and proper target device. If you are building for testing on device you should select "Unity-iPhone" build target and some iOS devices, which is connected to your Mac. If you are building for testing on simulator (Note: this needs appropriate SDK selection in Player Settings) then you should select "Unity-iPhone-simulator" target and appropriate simulator device.
Game stops responding after some time. Xcode shows "interrupted" in the status bar.
There could be several causes for this. Typical causes include:
- Scripting errors, like : using initialized variables, etc.
- Using 3rd party Thumb compiled native libraries. Such libraries trigger known problem in iOS SDK linker and might cause random crashes.
- Using generic types with value types as parameter (like List<int>, List<SomeStruct>, List<SomeEnum>) for serializable script properties.
- Using reflection when managed code stripping is enabled.
- Errors in native plugin interface (managed code method signature does not match native code function signature).
You need to review the XCode Debugger console for details. The Xcode Debugger console can be accessed from the Xcode menu Run->Console.
Xcode console shows "Program received signal: “SIGBUS” or EXC_BAD_ACCESS error.
This message typically appears on iOS devices when your application receives a NullReferenceException. There two ways to figure out where the fault happened:
Managed stack traces
Since version 3.4 Unity includes software based handling of NullReferenceException. AOT compiler includes tiny checks for null reference each time object method or field is accessed. This feature impacts your script performance that's why it is enabled only for development builds (for basic license users it is enough to enable "development build" option in Build Settings dialog, iOS pro license users additionally need to check "script debugging" option). If everything was done right and fault actually is happening in .NET code then you won't EXC_BAD_ACCESS anymore. Instead of it .NET exception text will be printed in Xcode console (or just your code will catch it in "catch" statement). Typical output might be:
Unhandled Exception: System.NullReferenceException: A null value was found where an object instance was required.
  at DayController+$handleTimeOfDay$121+$.MoveNext () [0x0035a] in DayController.js:122
It tells that fault happened in DayController class handleTimeOfDay method, which works as coroutine. Also if that's script code you probably will get exact code line, like in this sample "DayController.js:122". Which corresponds to following code:
Instantiate(_imgwww.assetBundle.mainAsset);
Usually this happens when script code doesn't properly check if WWW class successfully downloaded Asset Bundle, but blindly accesses its fields.
Native stack traces
Native stack traces are much more powerful tool for fault investigation, but it requires quite some expertise. Also usually you can't continue after these native (hardware memory access) faults happen. To get native stack trace type thread apply all bt into Xcode Debugger Console. Carefully inspect the printed stack traces - they may contain hints about where the error occurred. You might see something like:
...
Thread 1 (thread 11523):
#0 0x006267d0 in OptionsMenu_Start ()
#1 0x002e4160 in wrapper_runtime_invoke_object_runtime_invoke_void__this___object_intptr_intptr_intptr ()
#2 0x00a1dd64 in mono_jit_runtime_invoke (method=0x18b63bc, obj=0x5d10cb0, params=0x0, exc=0x2fffdd34) at /Users/mantasp/work/unity/unity-mono/External/Mono/mono/mono/mini/mini.c:4487
#3 0x0088481c in MonoBehaviour::InvokeMethodOrCoroutineChecked ()
...
First of all you should find the stack trace for "Thread 1". This is the main thread. The very first lines of its stack trace will point to the place where error occurred. In this example, it indicates that the NullReferenceException happened inside the "OptionsMenu" script's "Start" method. Looking carefully at this method implementation would reveal the cause of the problem. Typically NullReferenceExceptions happen inside the Start method when wrong assumptions are made about initialization order. In some cases only a partial stack trace is seen on Debugger Console:
Thread 1 (thread 11523):
#0 0x0062564c in start ()
This indicates that native symbols were stripped during the Release build of your application. The full stack trace can be obtained by following these guidelines:
- Select Debug configuration in Xcode project.
- Clean all targets.
- Build and run.
- Get stack traces again as described above.
EXC_BAD_ACCESS starts to happen only when external library is linked to Unity iOS application.
That usually happens when external library is compiled with ARM Thumb instruction set. Currently such libraries are not compatible with Unity iOS. Problem could be easily solved by recompiling library without Thumb instructions. Detailed instructions for library's Xcode project:
- in Xcode menu select "Project" -> "Edit active target"
- in "Target Info" dialog select "Configuration: All Configurations"
- in search field enter : "thumb"
- "Compile for Thumb" setting will appear, uncheck it and rebuild the library.
If library source is not available you should ask library provider for non-thumb version of the library.
Xcode console shows "WARNING -> applicationDidReceiveMemoryWarning()" followed by immediate application crash.
(Sometimes you might see a message like Program received signal: �0�.) This warning message is in many cases not fatal, and only indicates that iOS is low on memory and has asked applications to free some memory. Typically, some background processes like Mail will free some memory and your application can continue to run. However, if your application continues to use memory or ask for more, the OS will start killing applications at some point, and your application could be killed. Apple does not document what memory usage is safe, but empirical observations show that applications using less than 25 MB of RAM (80 MB for 3rd generation devices) do not have any memory usage problems. Applications using 40 MB of RAM may have memory problems on 1-2nd generation devices and may require a device restart to run properly. The primary metric on which you should rely is how much RAM your application uses. Your application memory usage consists of three major parts:
- application code (the OS needs to load and keep your application code in RAM)
- native heap (which is used by the engine to store its state, your assets, etc. in RAM)
- managed heap (which is used by your Mono runtime to keep C# or JavaScript objects)
Your application memory usage can be tracked by two Xcode Instruments tools: Activity Monitor and Object Allocations. You can start one or the other from the Xcode Run menu: Run->Start with Performance Tool->Activity Monitor and Run->Start with Performance Tool->Object Allocations. The first tool shows all process statistics, including Real memory, which can be considered the total amount of RAM used by your application.
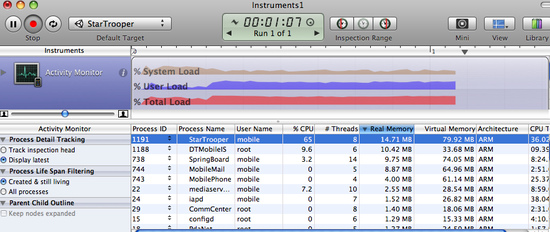
Note: The internal profiler shows only heap allocated by .NET scripts. Total memory usage could be obtained via Xcode Instruments as shown above. This figure includes the application binary, which will be loaded into memory and takes ~7 MB, some standard framework buffers, Unity engine internal state buffers, .NET runtime heap (number printed by internal profiler), and some other miscellaneous stuff.
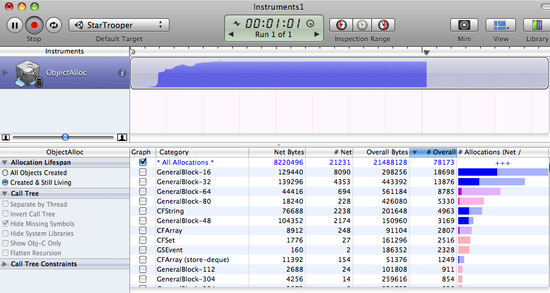
The other tool displays all allocations made by your application and includes native heap + managed heap statistics (don't forget to check the Created and still living box to get the current state of the application). You should look at the Net bytes value.
Some hints about how to keep the memory usage low:
- Reduce the application binary size by using the strongest iOS stripping options (Advanced license feature), and avoid unnecessary dependencies of various .NET libraries. Check for details in the player settings and player size optimization documentation
- Reduce your content size: use PVRTC compression for textures, use low poly models. Check for details in the reducing filesize documentation
- Don't allocate too much in your scripts. Track mono heap size and usage with the internal profiler
- Note: with Unity 3.0, the scene loading implementation has changed a lot, and now all scene assets are preloaded. This guarantees fewer hiccups while instantiating game objects. If you need more fine-grained control of asset loading and unloading during gameplay, you should use Resources.Load / Object.Destroy.
Querying the OS for the amount of free memory may seem like a good idea to evaluate how well your application performs. However, this has very little relation to real life, because the OS uses a lot of dynamic buffers and caches. You should always track memory consumption for your application and use it as the main metric. That should be the only reliable method. Just asking how much free memory is left from the OS will lead you nowhere. Pay attention to how the graphs from the tools described above change over time, especially after loading new levels.
Game runs fine when launched from Xcode and crashes on first level load when launched manually on the device.
There could be several reasons for this. You need to inspect the device logs to get more details. Connect the device to your Mac, launch Xcode, go to the Xcode menu Window->Organizer, select your device in the Organizer's left toolbar, click on the "Console" tab and review the latest messages carefully. Additionally, you may need to investigate crash reports. You can find out how to obtain crash reports here: http://developer.apple.com/iphone/library/technotes/tn2008/tn2151.html.
Xcode Organizer console contains "killed by SpringBoard".
There is a not well documented time limit for an iOS application to render its first frames and process input. If your application misses this time limit, it gets killed by SpringBoard. A typical case is an application with a large first scene. To avoid this problem, it is recommended to create a small initial scene which just displays a splash screen, waits a frame or two with yield and starts loading the real scene. A code sample for this could be:
function Start () {
    yield;
    Application.LoadLevel("Test");
}
Type.GetProperty() / Type.GetValue() cause crashes on device
Currently Type.GetProperty() and Type.GetValue() are supported only for .NET 2.0 Subset profile. You can select .NET API compatibility level in Player Settings.
Note: Type.GetProperty() and Type.GetValue() might be incompatible with managed code stripping and might need to be exclude Types that you use from stripping by supplying custom non-strippable type list. You can find more details in iOS player size optimization guide.
Game crashes with following error message "ExecutionEngineException: Attempting to JIT compile method 'SometType`1<SomeValueType>:.ctor ()' while running with --aot-only."
Mono .NET implementation for iOS is based on AOT (ahead of time compilation to native code) technology. This technology has own limitations. It compiles only these generic type methods (when value type is used as generic parameter), which are explicitly used by other code. When such methods are used only via reflection or from native code (i.e. serialization system) then they get skipped during AOT compilation. AOT compiler might be hinted to include code by adding mock method somewhere to the script code, which would touch missing methods and so get them compiled ahead of use time.
void _unusedMethod()
{
    var tmp = new SometType<SomeValueType>();
}
Note: value types are basic types, enums and structs.
Various crashes experienced on device in combination of System.Security.Cryptography and managed code stripping
.NET Cryptography services heavily rely on reflection thus are not compatible with managed code stripping which relies on static code analysis. Sometimes easiest solution is to exclude whole System.Security.Crypography namespace from stripping process.
Stripping process can be customized by adding custom link.xml file to your Unity iOS project Assets folder, which specifies what types or namespaces should be excluded from stripping. More details can be found in iOS player size optimization guide.
link.xml
<linker>
       <assembly fullname="mscorlib">
               <namespace fullname="System.Security.Cryptography" preserve="all"/>
       </assembly>
</linker>
"Ran out of trampolines of type 1/2" runtime error
This error usually happens if you use lots of recursive generics. You can hint AOT compiler to allocate more trampolines of first or second type. Additional AOT compiler command line options could be specified in PlayerSettings other settings section. For type 1 trampolines specify nrgctx-trampolines=ABCD, where ABCD is new trampoline count (i.e. 4096). For type 2 trampolines specify nimt-trampolines=ABCD.
 Android
Troubleshooting Android development
Unity fails to install your application to your device
- Verify that your computer can actually see and communicate with the device. More on this at Publishing Builds section.
- Please find the error (marked with red sign) in the Unity console. It should display a helpful error message.
Your application crashes immediately after start.
- Ensure you're not trying to use NativeActivity with devices that do not support it.
- Try removing any native plugins you have.
- Try to disable stripping.
- Use adb logcat to obtain the crash report from your device.
Building DEX Failed
This an error which will present itself similar to this
Building DEX Failed!
G:\Unity\JavaPluginSample\Temp/StagingArea> java -Xmx1024M
-Djava.ext.dirs="G:/AndroidSDK/android-sdk_r09-windows\platform-tools/lib/"
-jar "G:/AndroidSDK/android-sdk_r09-windows\platform-tools/lib/dx.jar"
--dex --verbose --output=bin/classes.dex bin/classes.jar plugins
Error occurred during initialization of VM
Could not reserve enough space for object heap
Could not create the Java virtual machine.
This is usually caused by a bad version of Java being installed on your machine. Try updating your Java install to the latest version and this will generally solve this issue.
My game quits when I press the sleep button
Please change the <activity> tag in the AndroidManifest.xml to contain <android:configChanges> tag as described here.
An example activity tag can look like this:
<activity android:name=".AdMobTestActivity"
                  android:label="@string/app_name"
                  android:configChanges="keyboardHidden|orientation">
            <intent-filter>
                <action android:name="android.intent.action.MAIN" />
                <category android:name="android.intent.category.LAUNCHER" />
            </intent-filter>
        </activity>